Hexagon Measurement SystemsNo matter what Hexagon measurement equipment or software you use, we want to hear your ideas and suggestions on how we can improve.
Thanks for your assistance in helping us shape the future. |
|

 Evaluation of Envelope Modifier (ISO 14405-1) In the Report
For reference: I'm using PC-DMIS 2020 R2 SP8.
I've been seeing the E modifier next to dimensions in recent drawings released to the ISO 14405-1 specification. When I go to look at the report to see what the two measurements (LP and GN) look like for a shaft, it appears that the lower limit is the only one that has been assigned a modifier (E) when it's clear that the upper limit was evaluated with the LP modifier and the lower limit was evaluated with the GN modifier.
My issue with the report is: it's not explicitly clear which modifier is being used. This isn't an issue for your average metrologist/CMM programmer, but to the outsider, it can be problematic and cause some confusion.
Can we have an update to the report so that when the E modifier is used, the report clearly states which modifier was used to evaluate the upper/lower limits of a shaft/hole?
I can easily work around this by reporting two separate dimensions with the appropriate modifiers for each, but I shouldn't have to do this.

Possibility to re-call a simultaneously evaluation as an active alignment
I would like to have the possibility to activate a Datum feature alignment where a Datum has a Maximum Material Condition e.g. A/B(M)/C(M) which is used for a simultaneously evaluation. It would make it a lot easier to show some single points deviation or similar to an active alignment instead of adding each point of interest to a Dimension which then needs also put in for simult. check.. greetings Rob

GD&T dimensions missing on CMM's report when exported as a text file
GD&T dimensions are missing on the final output when exporting CMM’s report as a text file. This used to be there and it was fine before the upgrade to PC-DMIS 2020 version but now the dimensions are not there anymore.
I was informed by Hexagons Customer Support that this was a design decision made by the Dimensional Reporting product owner.
So this is as designed!!!
I would strongly suggest and I hope that this gets approved to be brought back to the way it was.
This causes an inconvenience and a huge problem which will result in changing and trying to figure out another way to link up CMM results with SolidWorks Inspection software if any other way even exists.
If this proposal gets approved and changed, customers should get notified/emailed of the change ASAP so we can start using it again as it’s intended.
Text output for the CMM results without dimensions on it will not do anybody any good. What’s the point of even having that option in PC-DMIS then, if certain dimensions will not be on it!?

Ability to use Multiple Print Commands with different formats.
Ability to use Multiple Print Commands with different formats.
Reason for request:
When using Print Commands to print one RTF report and another Print Command to print a PDF.
The end results is two PDF reports.
Example:
PRINT/REPORT,EXEC MODE=END,$
TO_FILE=ON,OVERWRITE=C:\Users\Public\Documents\Hexagon\PC-DMIS\2020 R2\Test Print Commands\test.RTF,AUTO OPEN=OFF,$
TO_PRINTER=OFF,COPIES=1,$
TO_DMIS_REPORT=OFF,FILE_OPTION=INDEX,FILENAME=,$
REPORT_THEORETICALS=NONE,REPORT_FEATURE_WITH_DIMENSIONS=NO,$
TO_EXCEL=OFF,$
PREVIOUS_RUNS=KEEP_INSTANCES
CS1 =REPORT/TEMPLATE, FILENAME= TEXTONLY.RTP, Section=-1,REPORTMODE=INSERT
PARAM/=
ENDREPORT/
PRINT/REPORT,EXEC MODE=END,$
TO_FILE=ON,OVERWRITE=C:\Users\Public\Documents\Hexagon\PC-DMIS\2020 R2\Test Print Commands\test.PDF,AUTO OPEN=OFF,$
TO_PRINTER=OFF,COPIES=1,$
TO_DMIS_REPORT=OFF,FILE_OPTION=INDEX,FILENAME=,$
REPORT_THEORETICALS=NONE,REPORT_FEATURE_WITH_DIMENSIONS=NO,$
TO_EXCEL=OFF,$
PREVIOUS_RUNS=DELETE_INSTANCES
CS2 =REPORT/TEMPLATE, FILENAME= TEXTONLY.RTP, Section=-1,REPORTMODE=INSERT
PARAM/=
ENDREPORT/

2020 R2 Profile - CAD graphic analysis improvement
In 2020 R2, the calculations/interpretations of profile tolerances have changed. The idea now, for a unilateral tolerance, is that the tolerance zone is offset from the nominal surface an appropriate amount and the zone is expanded/contracted until the surface is "snug".
I created a simple example. Offline, I created an external cylinder. I requested the profile of the surface with [.xxx U 0]. I turned on CAD graphic analysis and the tolerance zone is still centered on nominal. What's worse is that the deviation shows toward the wrong extreme of the zone.
Can this feature be improved so that the graphic analysis of the zone is shifted and the deviation can be shown properly?
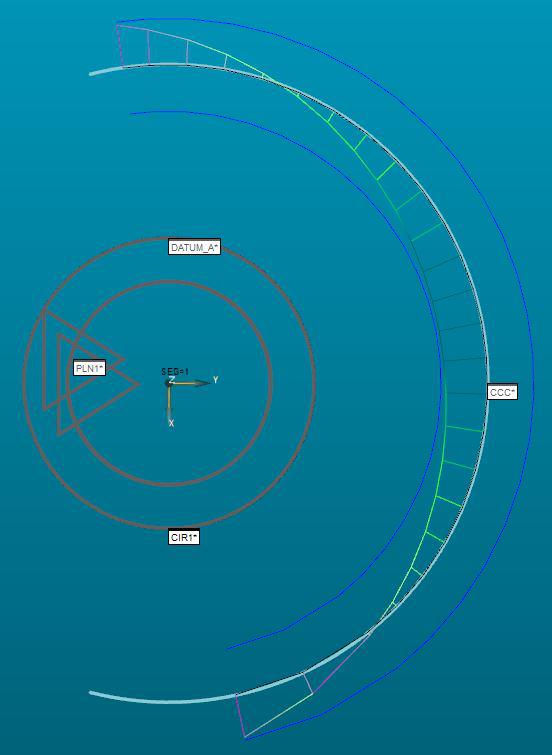
As you can see, at [.xxx U 0], the outer edge would be at the extreme outer edge of the zone. PC-DMIS is showing it at the inner edge.
Highlight the associated features when the cursor is on a dimension command
Highlight the associated features when the cursor is on a dimension command so that people can easily find out which feature is out of spec.

Review the symmetry ISO 1101
The symmetry doesn't directly.Please review.

PCDMIS Settings copy from public
Will be useful to have automatic procedure when we install new pcdmis release when installation procedure finish to ask if you want to copy settings or not from previous version. For example we use our own reporting and QDAS settings and always I need to copy - paste all folders from public from previous version to new.
When we install new SP we need to be careful because new installation overwrite old settings with default.

Animation of a part program should be more realistic
We should improve PC-DMIS form a graphical animation of a mesurement routine to a kinematic simulation. Then we can also check execution times and we can see also different speeds betwenn a move and a measurment inside of a feature.

Intervention limit for selected nominal dimension comparisons
Required: Define a separate action limit for each individual characteristic in the measuring program.
e.g: Characteristic 1 --> intervention limit 85%
Characteristic 2--> no intervention limit
Characteristic 3--> intervention limit 70%
Eingriffsgrenze für ausgewählte Nennmaßvergleiche
Es ist nur möglich eine Eingriffsgrenzen zu definieren (z.B. 80% oder 90%), die dann für alle Merkmale im Messprogramm wirksam ist.
Wunsch: Für jedes einzelne Merkmal im Messprogramm eine seperate Eingriffsgrenze definieren.
z.B.: Merkmal 1 --> Eingriffsgrenze 85%
Merkmal 2--> keine Eingriffsgrenze
Merkmal 3--> Eingriffsgrenze 70%
Customer support service by UserEcho
