Hexagon Measurement SystemsNo matter what Hexagon measurement equipment or software you use, we want to hear your ideas and suggestions on how we can improve.
Thanks for your assistance in helping us shape the future. |
|

 Vision - Possibility to use live view like a projector by using 2D dxf Contour shown in Live Image
When measuring with the optics, it should be possible to superimpose an overlay on the live image.
Similar to a wireframe model or a DXF contour, the lines of the nominal geometries should lie over the camera image.
This allows the operator to visually compare the actual and nominal contours, just like with a projector. Furthermore, the customer wishes to carry out manual measurements in the live view between the nominal and actual contour. Such as distances, angles etc.

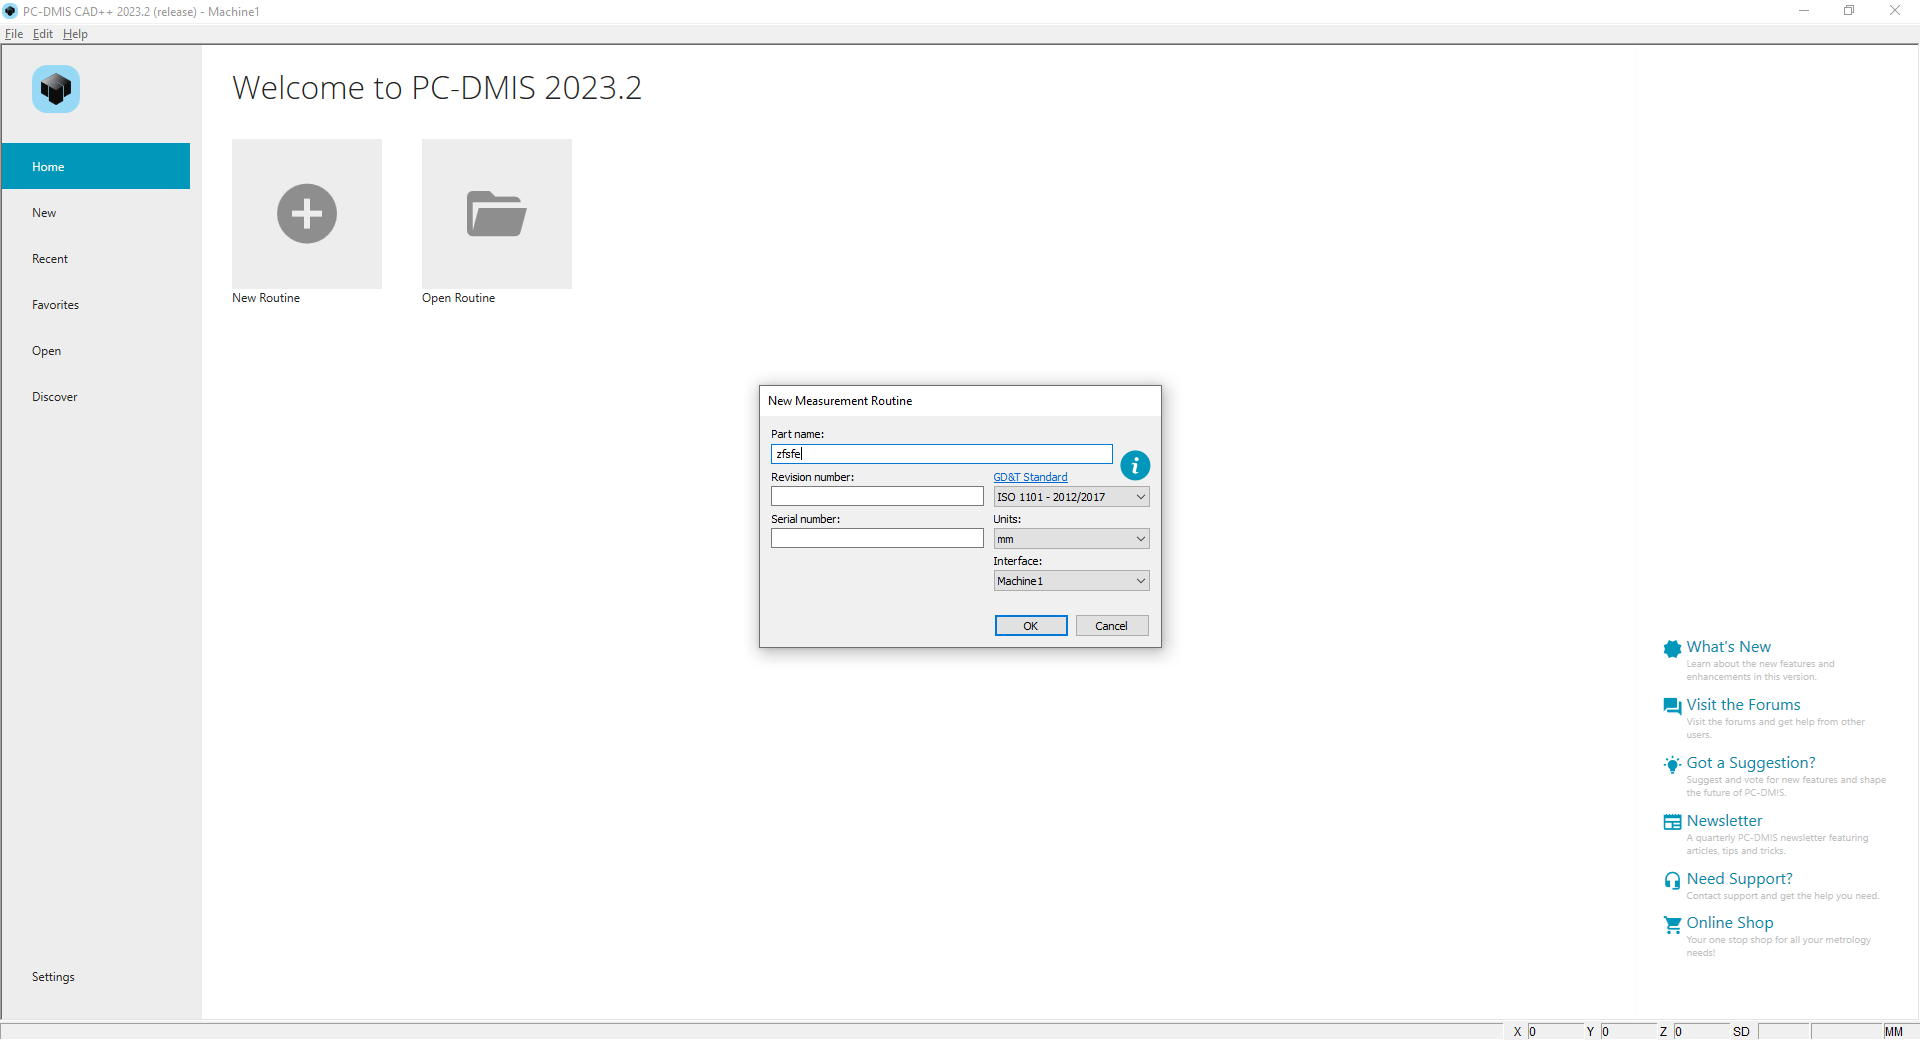
Why you don´t have a way or option to save a New file choosing by us a other folder?
Good Morning,
In the home page when I create a new file, I can not save my new file routine on a folder choosing by me.
Beacause I think there is a default folder already defined by PC-DMIS, but it is a folder that is located in an APPdata folder. This means we have to copy to the folder we want.
Can you do an improvement so that I can choose a folder to save my file?
Best Regards

autocalibrate probes within a single routine based on last calibrated date
I'm looking to have an auto calibrate command for all probes/tips within a single routine that have been calibrated outside a specified range. With this, it would also be nice to have a way to see all used probes and tips within the routine without having to go into each probe individually and select mark used. Currently we calibrate probes by opening each probe (F9), selecting mark used and looking at the calibration dates/times. If it has been outside of 24 hours we typically calibrate only the necessary tips. I'd like a way to do this automatically, and to be able to use this command from a form.
Thanks

Alphabetize Report Option
I would like an option to alphabetize inspection reports. I typically inspect parts to a ballooned drawing. I resort to saving all my dimensions until the end of my program and name them BALLOON1, BALLOON2, etc. The problem is when I have a part with hundreds of balloons, I'm hopping around from alignment to alignment and workplane to workplane. It would save time if I could create the dimensions as I'm creating features so that I'm recalling alignments and switching workplanes less often.

Shape options for clearance
Clearance cube works well for square/rectangle parts but not ideal for cylindrical shaped parts. A clearance cylinder would work well for round parts that have features i.e. circles etc... on the outer perimeter of the cylinder.

Auto Element Kreis Scan auch mit Stützpunkte/ Auto element circle scan also with support points
Mein Idee beinhaltet dass beim Auto Element Kreis Scan auch Stützpunkten möglich sind.
Aktuell ist dies nicht möglich.
My idea is to program the scan with the auto element circle also with interpolation points.
Currently this is not possible.

Let some settings/files be stored on a network for shared settings
Let PC-DMIS store some setting/files on a network so they can be accessed from different machines / PC-DMIS installations.
I'm talking about settings/files like:
- usrprobe.dat
- MaterialCoefficients.xml
- xxx.MSExml (StrategyEditor)
- MessageBoxOptions.dat
- The User Interface (Icons and so on)
- Colors of the edit window
- Colors of the features
- and many more
Having many machines and many pc-dmis installs is a pain to maintain which costs hours.
Having a central settings directory on the network would save a lot of time.

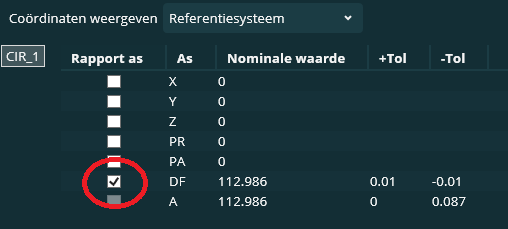
Enable DF value automatically off in settings
When programming True Location dimensions (FCFLOC), i would really love to turn off the DF (diameter) setting by default instead of turning it off at every instance.
This could be a setting in the settings list at the (F5) settings editor.

scan set- profile surface dimension- graph=on will show surfaces highlighted in addition to point arrows
it would be nice to either manually assign, or automatically attach, surfaces in a scan set that can be displayed graphically when analyzing a scan set. sometimes when scan sets are dense the arrows make it easy to see the deviation, but the actual surfaces that are measured/not measured can be more difficult to determine. Could the surfaces also be highlighted as shown in the attachment? Presentation1.pdf
Servicio de atención al cliente por UserEcho
