Hexagon Measurement SystemsNo matter what Hexagon measurement equipment or software you use, we want to hear your ideas and suggestions on how we can improve.
Thanks for your assistance in helping us shape the future. |
|

 PC-DMIS in one language, the report in another
I am running PC-DMIS with swedish language setting and thus, the report is also in swedish. However, it would be optimal if I could change the report template language to english - just for the report as we have customers all around the world.
In order to that today, I'd have to either run PC-DMIS in english (all the time) or change language, start PC-DMIS, open my program and print the report.
Would it be possible to add the possibility for the report templates to use a different language (other resources from the .dll's) template only for printing?

 Need Square Tubing!!!!
Been begging for square tubes since TubeShaper came out. I have many customers asking for this.

 Add bent tube to straight tube capabilities
I measure a lot of bent tubes with copes (fish mouth cuts) on the ends of the tubes. Would like to have the capability in TubeShaper to take a measured bent tube (with measured cylinders on each end) and convert it to a straight state with the measured end cylinders in the correct orientation. Then the straight tube can be exported as a CAD model so it can be used in a tube laser machine.

 Additional method for measuring long tubes (leap-frogging)
Currently the only method available for measuring long tubes (leap-frogging) is the "Move Tube" where it is required to measure two straights. If all straights are just too big to allow for selection/measurement of any two, this obviously won't work. Perhaps we can add an additional method, similar to that of G-Tube, where we add a displacement T-square, perpendicular to any straight.

 Continuing development of Textonly Legacy Reporting
To have Legacy Textonly report supporting PC-DMIS Dimensions functionalities, or to have a similar report that is true text report and not just pictures that look like text.

 Auto circle
Add auto circle for star probe

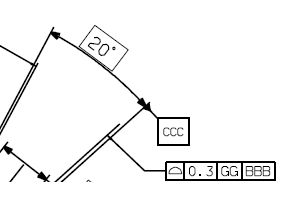
 Datum definition allow multiple characters
Allow to add multiple characters on a datum definition not only 2.


 New point construction method: "high point"
Finding the "high point" of a feature or scan is a very common measurement task.
In pc-dmis, this is a complex task, that requires an understanding of array indexing, and significant manual entry into a generic feature. It is prone to error, is very time consuming, and for users never exposed to a programming language it's a complete non-starter.
A simple, interface-based point construction method could be added to address these issues. The new method should be based on the DMIS method "CONST/EXTREM". It is very complete, and since pc-dmis imports DMIS code - it only makes sense to have a 1 to1 mapping of the DMIS definition.

 Add a length and width spacer option for auto planes
Currently PC-DMIS has a square spacer that can be set for auto planes. It would be nice if we could specify the length and width of the spacer
Customer support service by UserEcho


